Welcome to the SELPHI2 server

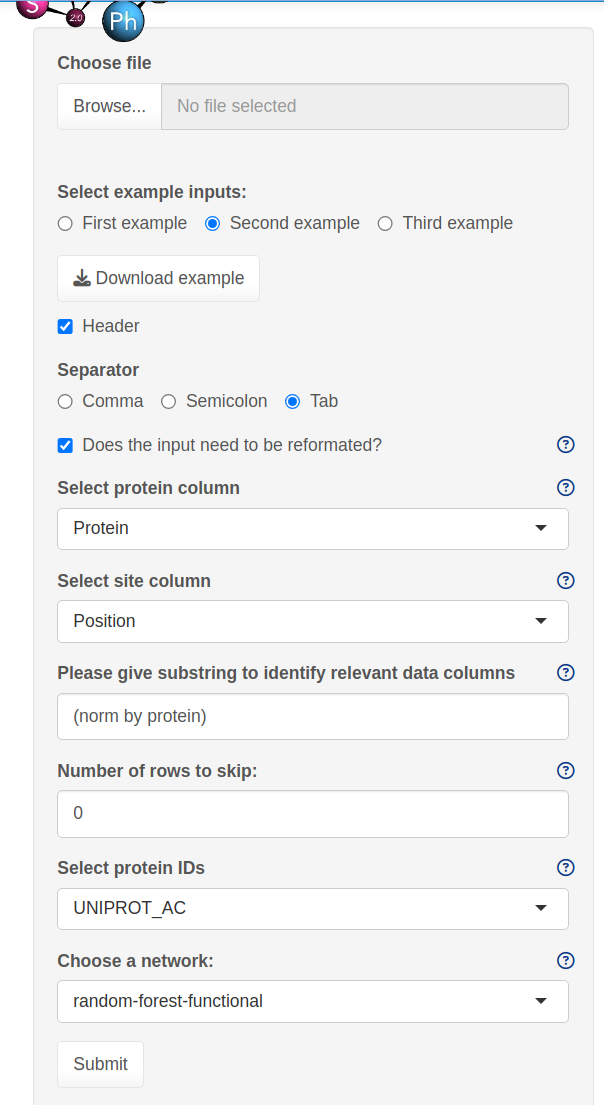
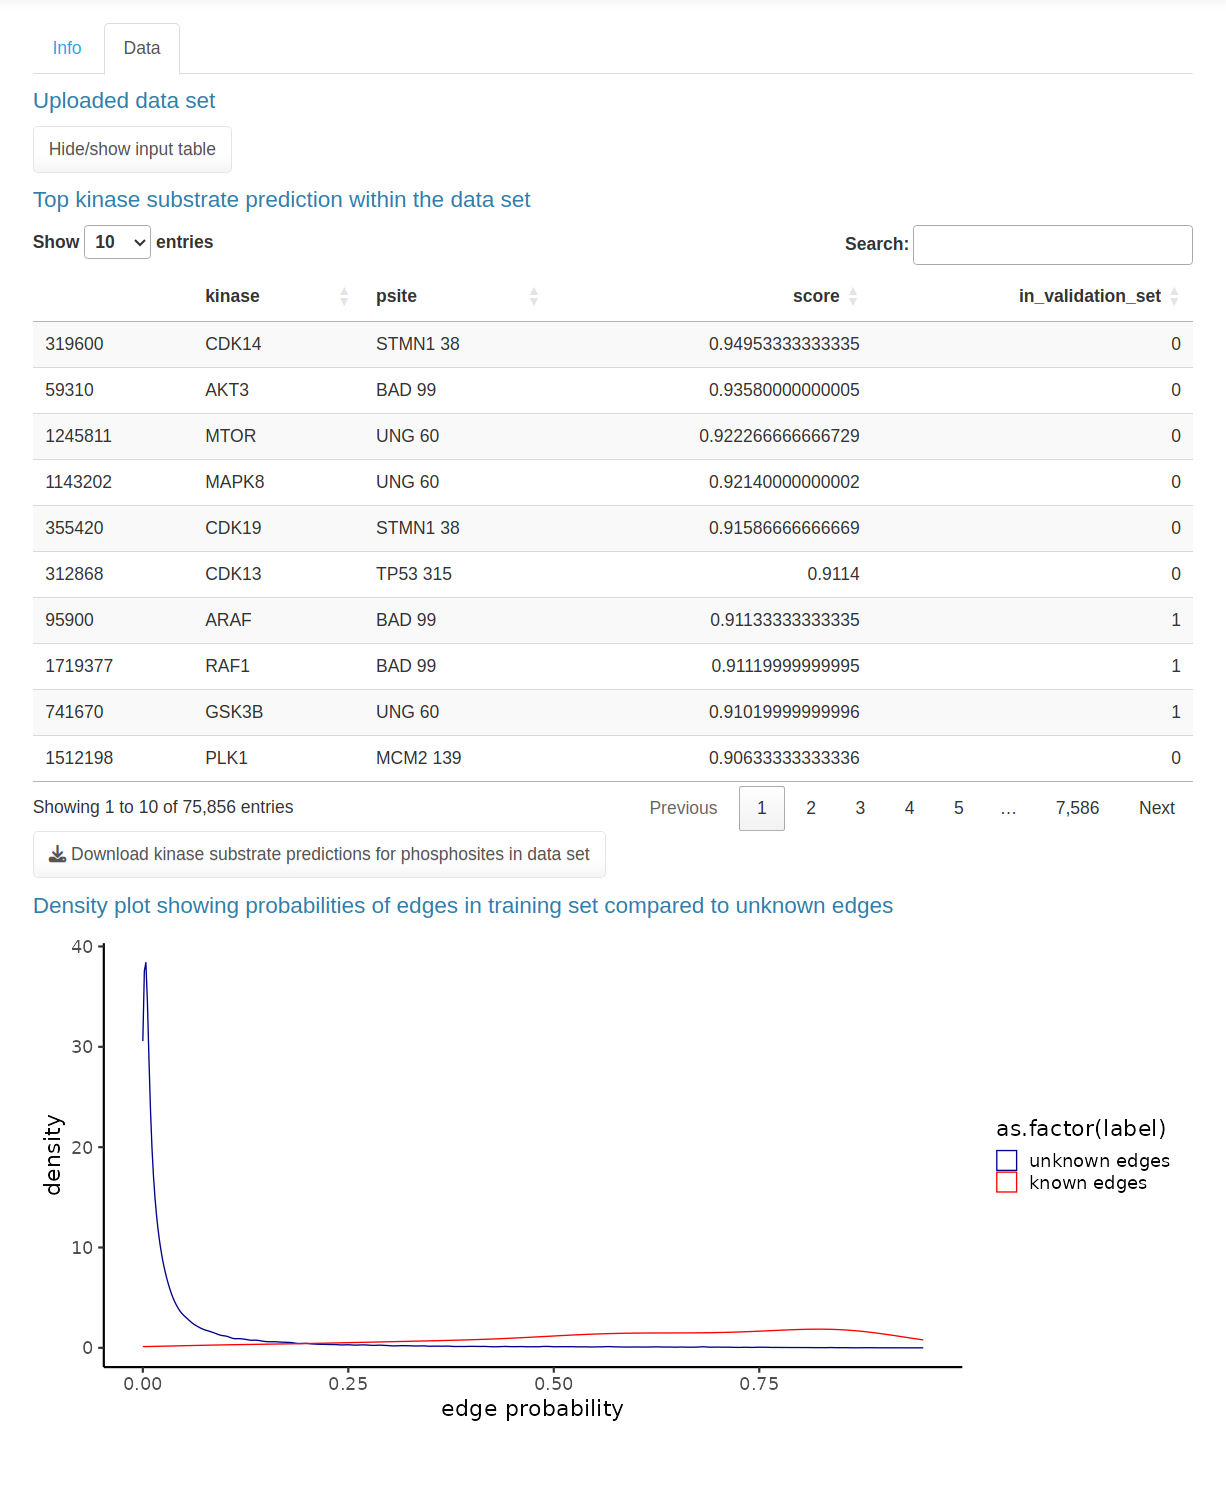
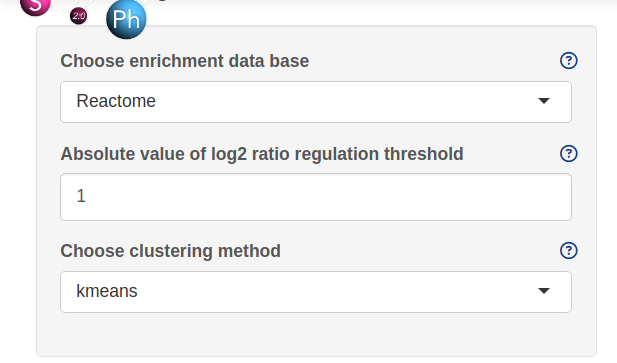
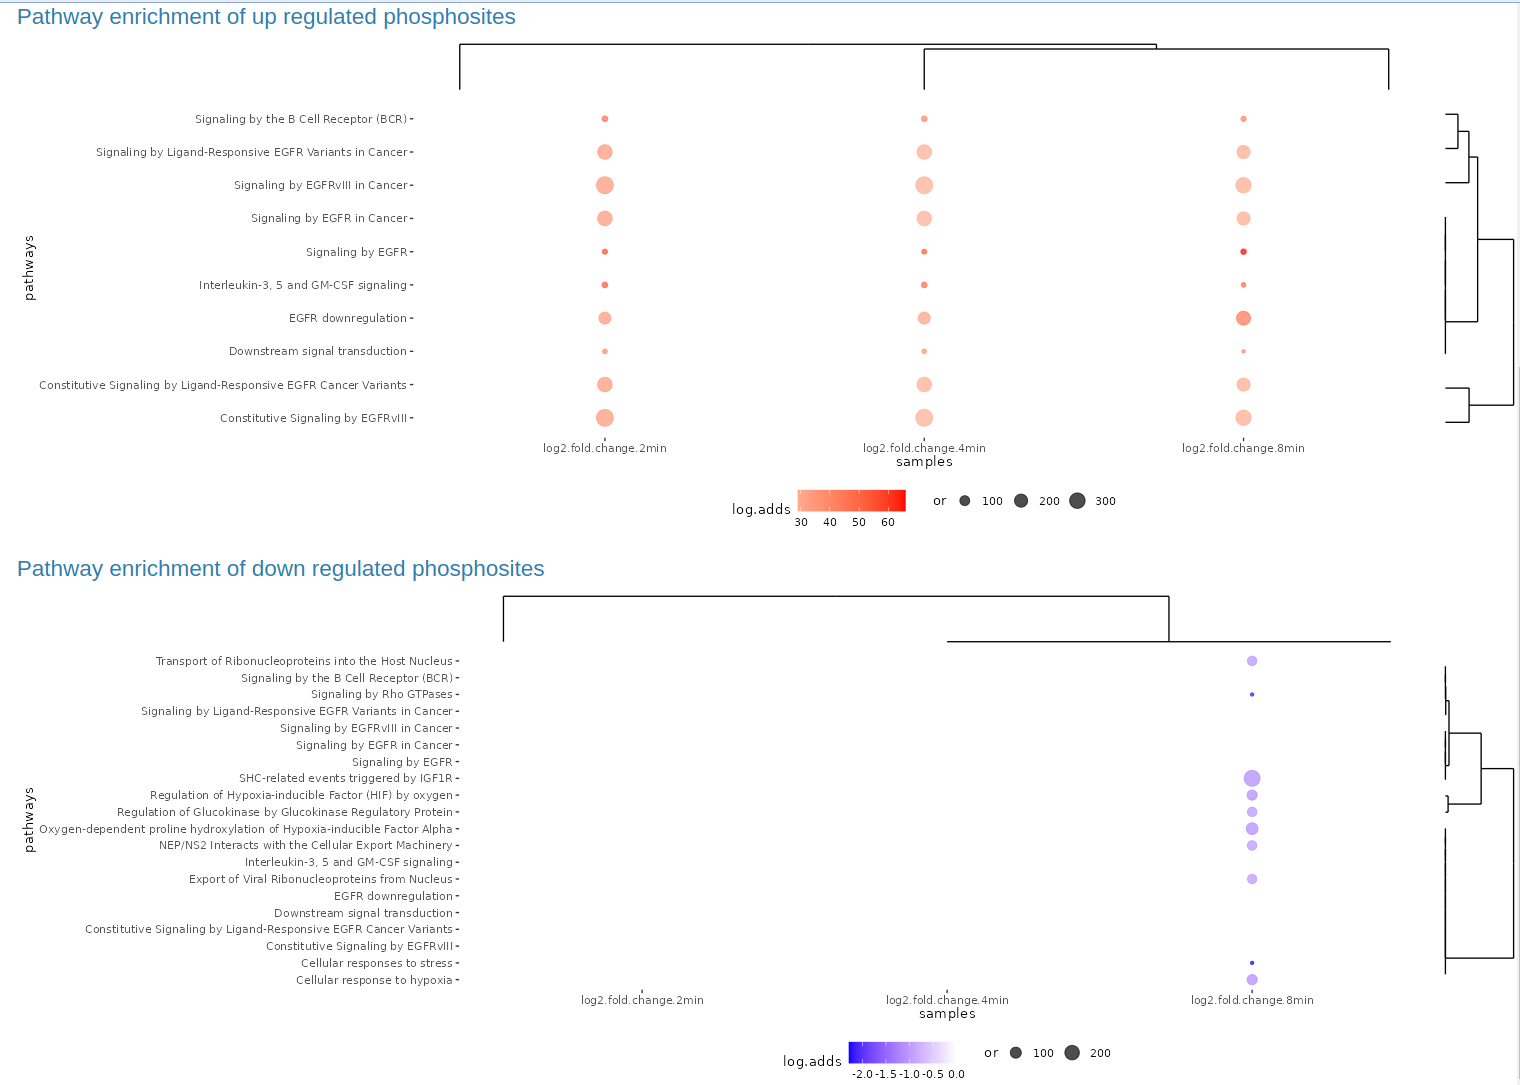
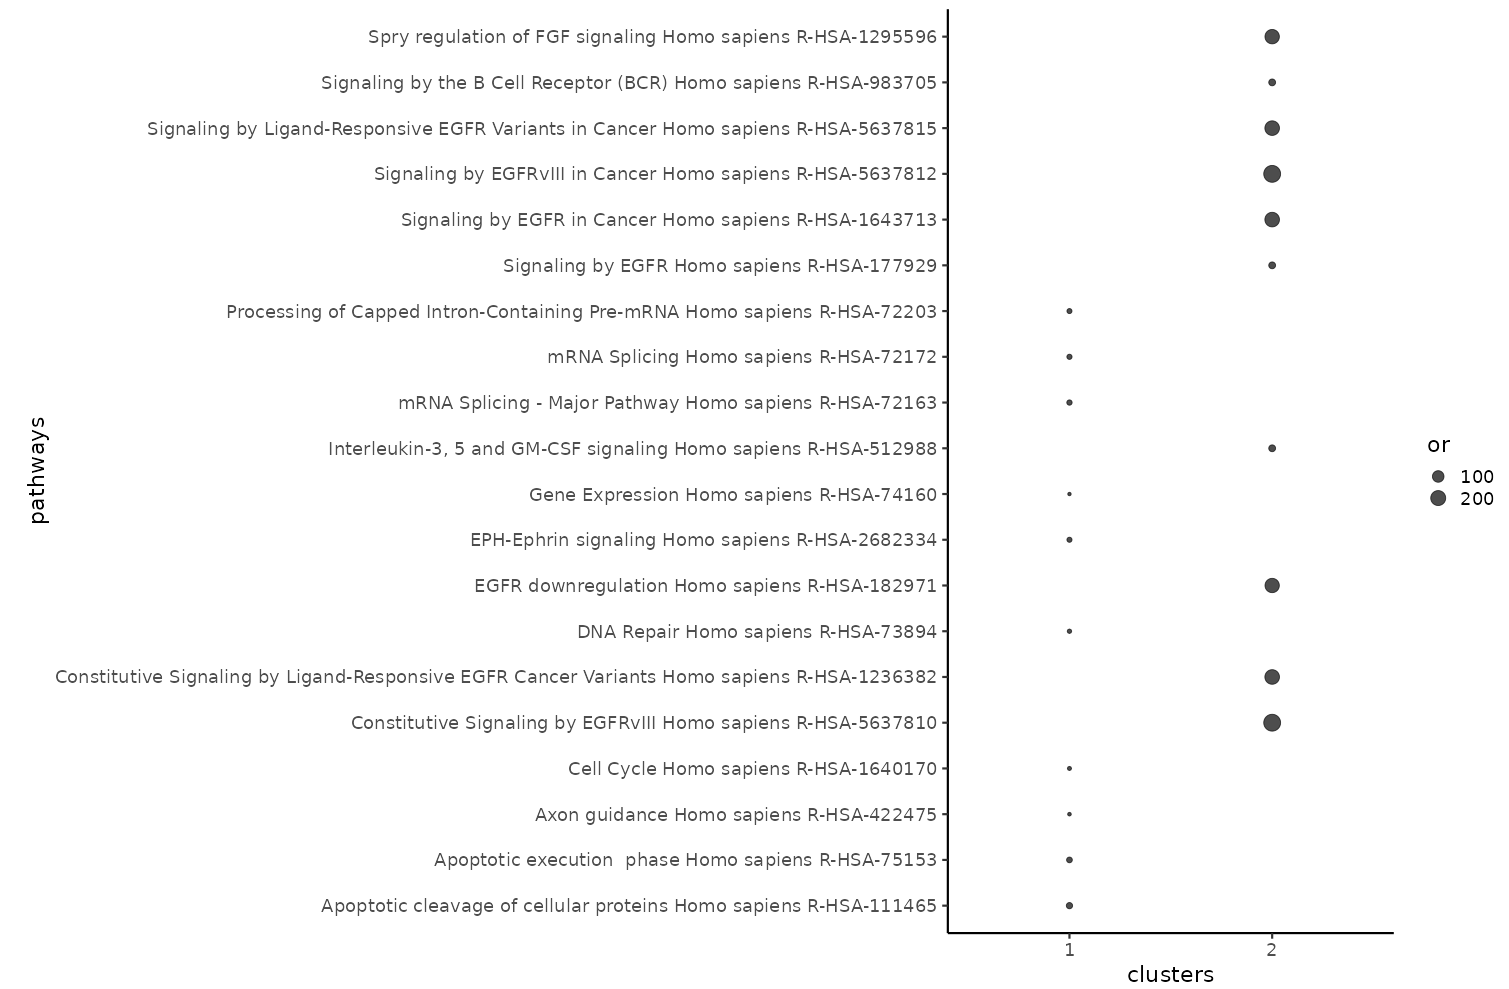
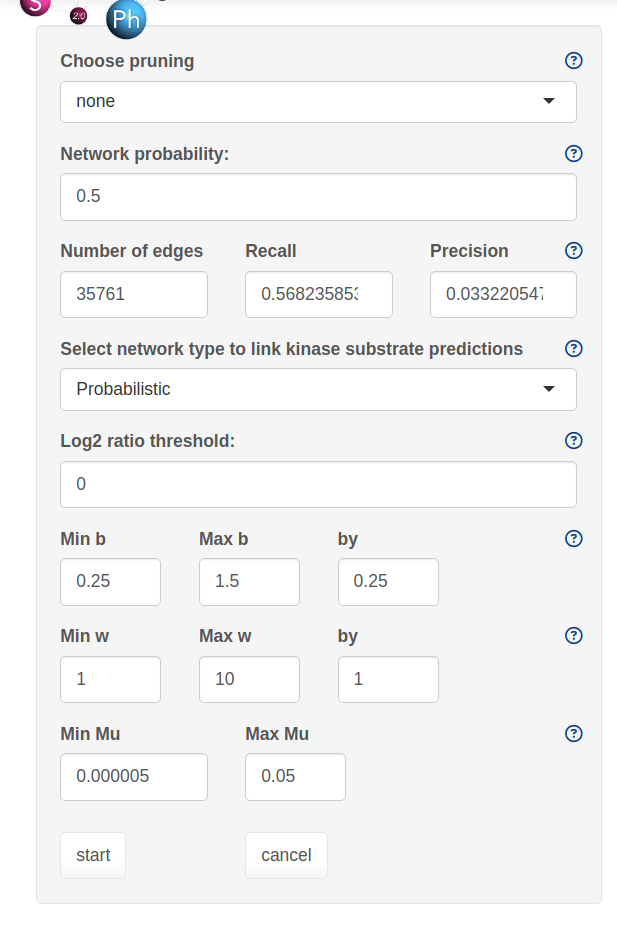
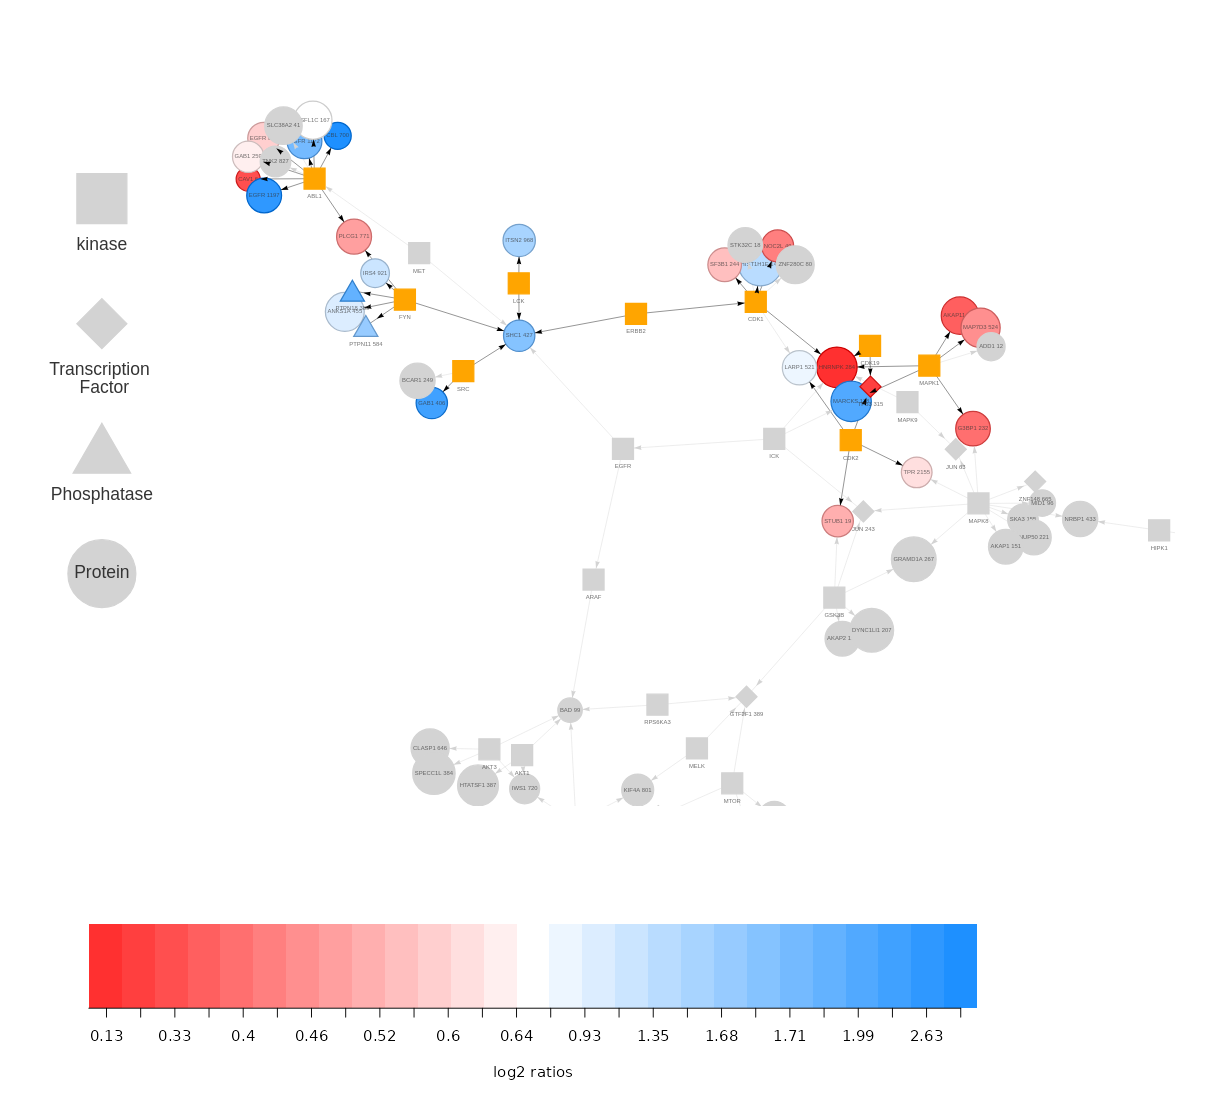
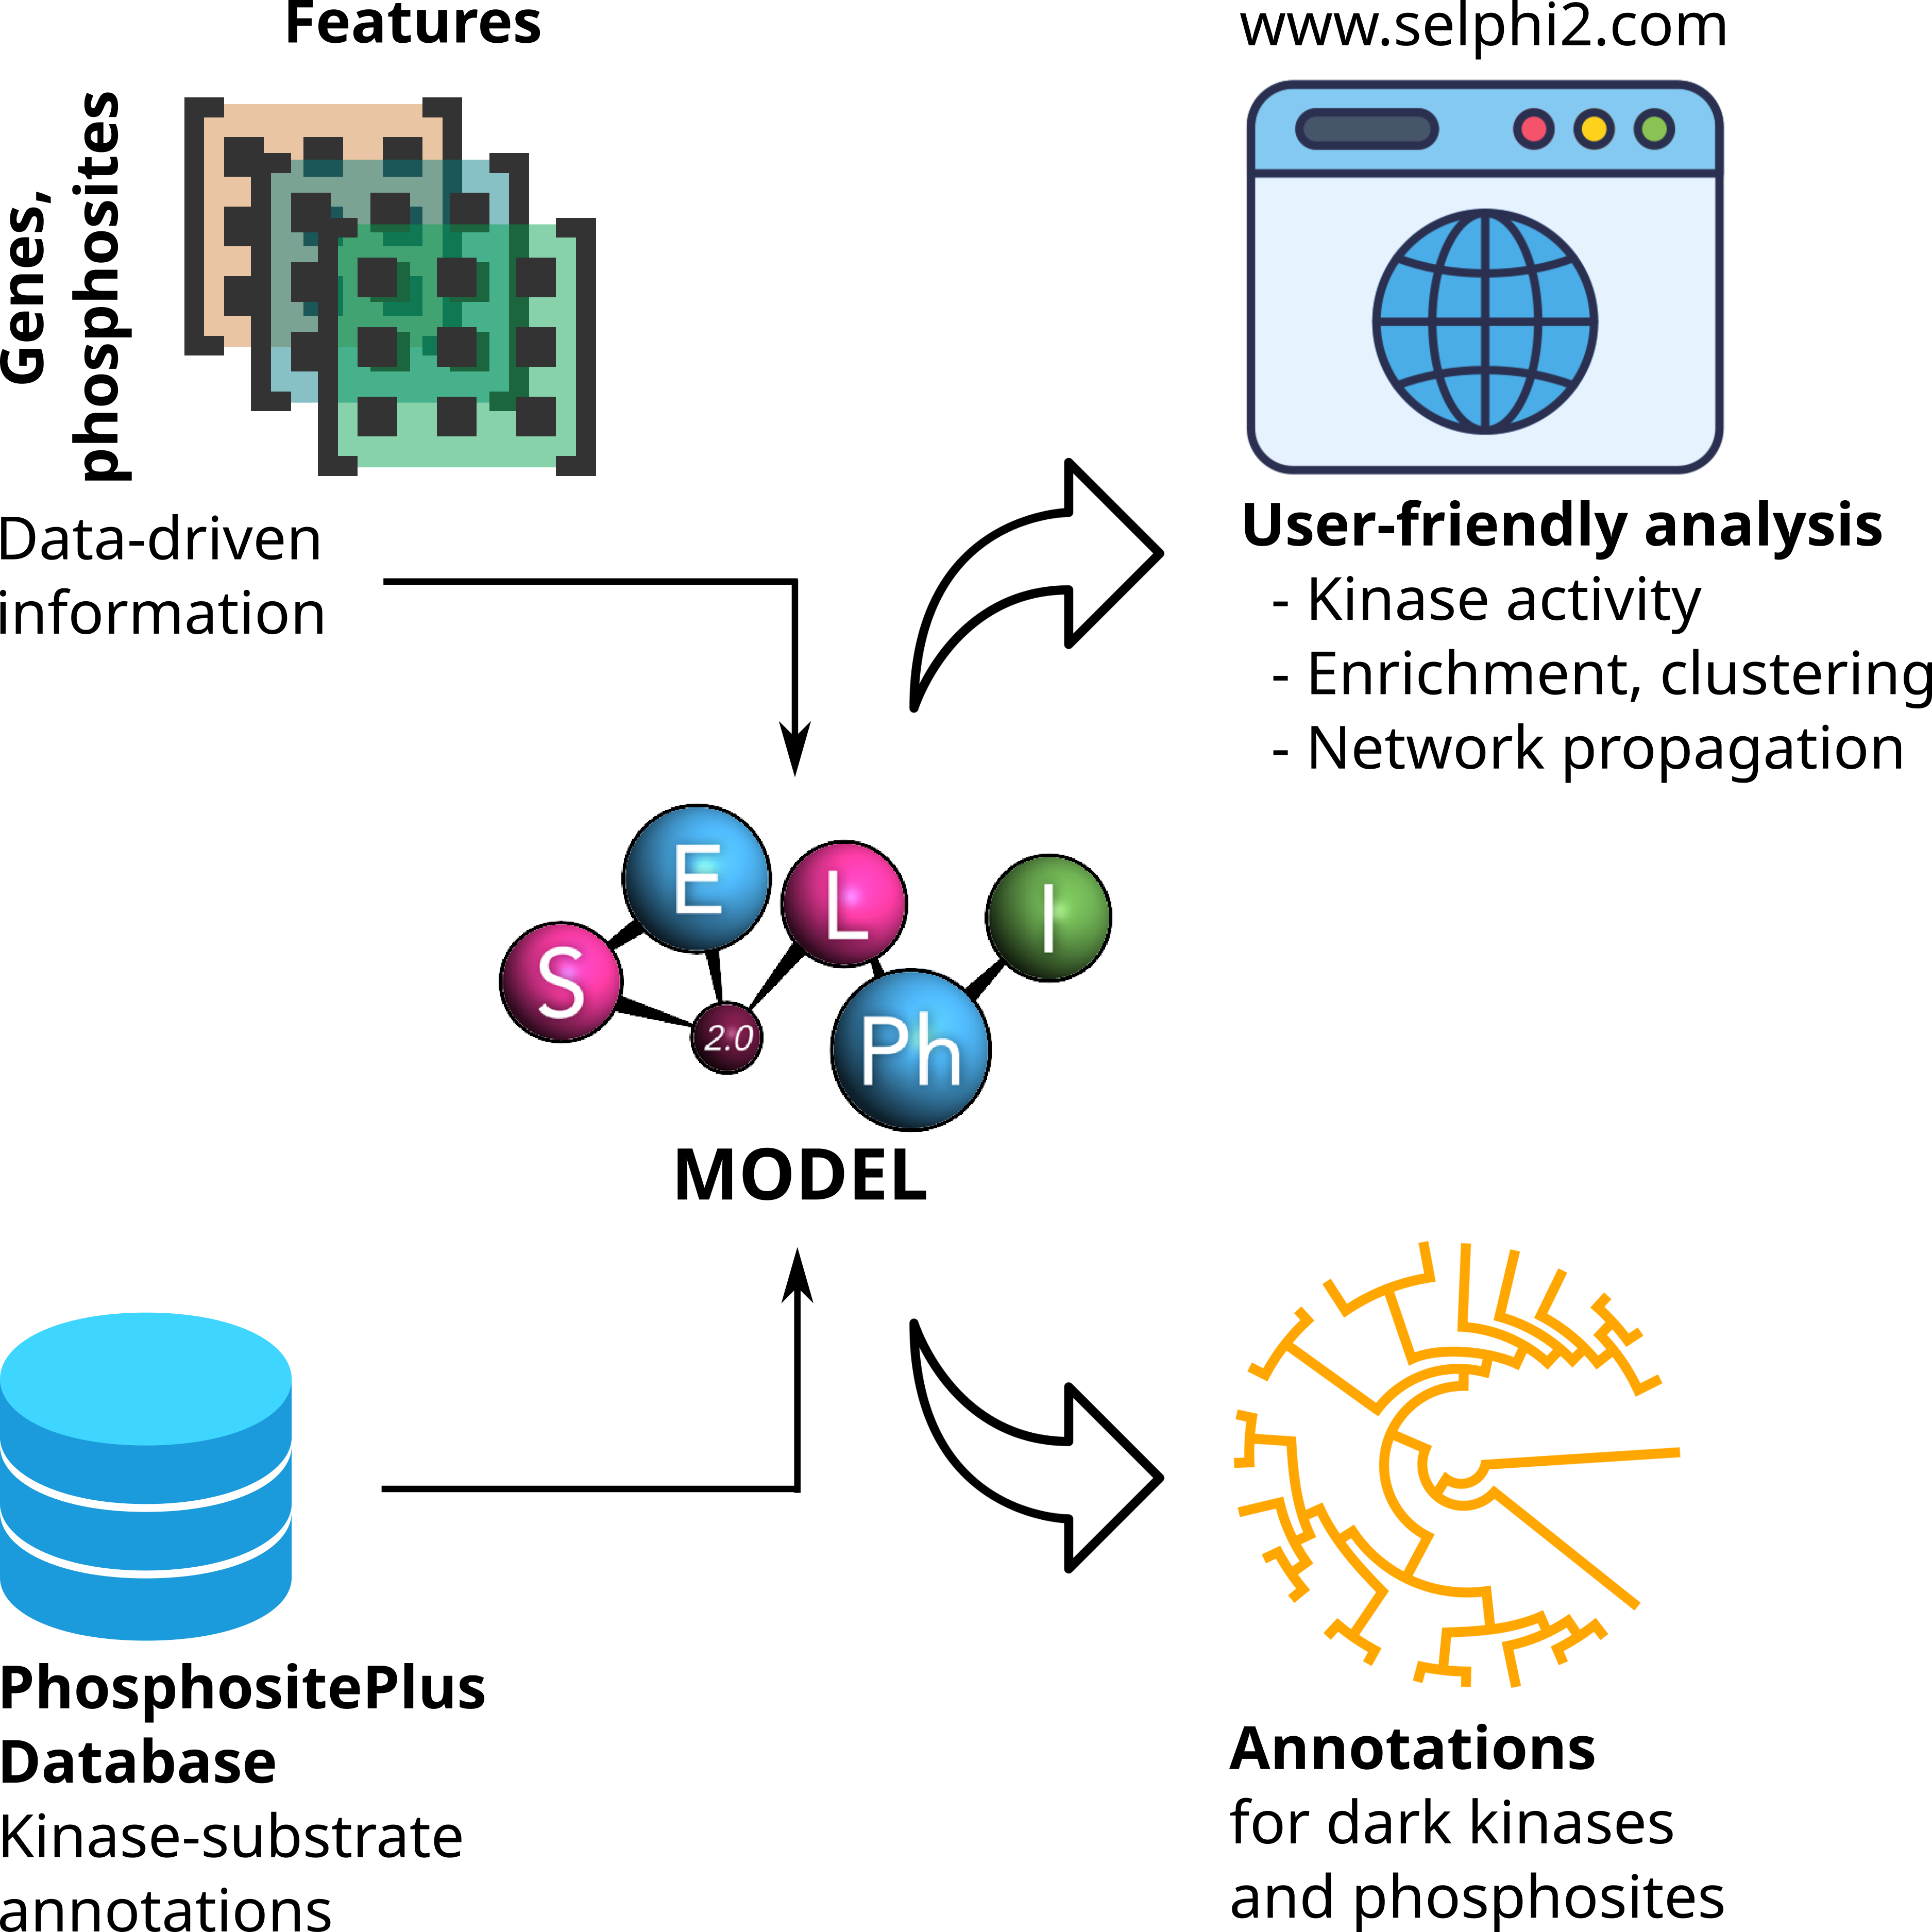
The SELPHI 2.0 (Systematic Extraction of Linked PhosphoInteractions 2.0) server provides you with a platform to analyse phosphoproteomics data, including providing you with a list of high confidence kinase-substrate predictions for the phosphosites included in their data. SELPHI 2 contains 73+ million kinase substrate predictions. You can also fit the kinase substrate predictions to their data set to identify context-specific sub networks, conduct pathway enrichments and download highly probable edges supported by external evidence from external publications.


SELPHI Logo


If you find SELPHI2.0 useful please cite:

Maier BD#, Petursson B#, Lussana A# and Petsalaki E, SELPHI 2: Data-driven extraction of human kinase-substrate relationships from omics datasets. bioRxiv, 2024. https://doi.org/10.1101/2022.01.15.476449

(#) These authors contributed equally.

All code for reproducing this project as well as a Docker image of the web server can be found at: https://gitlab.ebi.ac.uk/petsalakilab/selphi_2. The feature and prediction matrix can be downloaded from Zenodo.


License for SELPHI2 server

Copyright (c) 2024 Petsalaki Group, EMBL-EBI

Permission is hereby granted, free of charge, to any person obtaining a copy of this software and associated documentation files (the "Software"), to deal in the Software without restriction, including without limitation the rights to use, copy, modify, merge, publish, distribute, sublicense, and/or sell copies of the Software, and to permit persons to whom the Software is furnished to do so, subject to the following conditions:

The above copyright notice and this permission notice shall be included in all copies or substantial portions of the Software.

THE SOFTWARE IS PROVIDED "AS IS", WITHOUT WARRANTY OF ANY KIND, EXPRESS OR IMPLIED, INCLUDING BUT NOT LIMITED TO THE WARRANTIES OF MERCHANTABILITY, FITNESS FOR A PARTICULAR PURPOSE AND NONINFRINGEMENT. IN NO EVENT SHALL THE AUTHORS OR COPYRIGHT HOLDERS BE LIABLE FOR ANY CLAIM, DAMAGES OR OTHER LIABILITY, WHETHER IN AN ACTION OF CONTRACT, TORT OR OTHERWISE, ARISING FROM, OUT OF OR IN CONNECTION WITH THE SOFTWARE OR THE USE OR OTHER DEALINGS IN THE SOFTWARE.

Upload data for SELPHI2 server

Please upload data for analysis. The default format is columns representing samples and rows representing phosphosites. The first columns should contain the phosphosite information, which should be formatted as GeneName in either HGNC, Entrez or Uniprot (specify in 'select protein ID type') followed by a space and the phosphorylation site. Only the position is needed, additional residue annotation (S,T,Y) like ("Y263" or "263Y") is automatically transformed into the position:

Phosphosites Log2 Cond1 Log2 Cond2 Log2 Cond3 Log2 Cond4
GeneName PhosphorylationSite 1.2 1.4 1.5 1.1
AAGAB 310,311 0.8 0.7 1.0 0.9
ABCF1 140 2.3 2.0 2.2 2.1
ACIN1 1004 0.5 0.6 0.7 0.4

If your data does not conform to this format, you can indicate which columns contain information on protein names (UniProt, Entrez or HGNC) and the position in the protein or the peptide. If the position given is within the peptide the peptide will be mapped onto the UniProt sequence to find position within the protein. Additionally, you can mark which columns contain data (by typing in a shared substring like "log2_") and which ones should be discarded analogously.

SELPHI2 by default takes log2-fold values. If you input ratio values they will be log2-transformed.

Predictions can be made for the phosphosites in the data set in the following ways:
(i) Random forest: Random forest classifier was used to generate a list of kinase substrate prediction as is described in our recent publication[1], which can be downloaded from Zenodo. Kinase-substrate relationships with a score below 0.3 were filtered out for the webserver for better performance. By default, we consider 0.5 as cutoff for kinase-substrate relationships.
(ii) Random forest functional (recommended): Same as (i) but only for phosphosites that are likely to be functional according to functional score developed previously[2].

After uploading your phosphosites and clicking the submit button, you will automatically transfered to the "Data" tab which will contain your formatted input table for visual check, an annotated table with the top kinase-substrate relationships in your data as well as a density plot to show the distributions of unknown kinase-substrate relationships predicted by SELPHI and those found in the validation set.

References

1. Maier BD#, Petursson B#, Lussana A# and Petsalaki E, SELPHI 2: Data-driven extraction of human kinase-substrate relationships from omics datasets. bioRxiv, 2024. https://doi.org/10.1101/2022.01.15.476449
2. Ochoa, D., Jarnuczak, A.F., Viéitez, C. et al. The functional landscape of the human phosphoproteome. Nat Biotechnol 38, 365–373 (2020). https://doi.org/10.1038/s41587-019-0344-3

Enrichment of Phosphorylated Proteins

To perform the enrichment analysis, begin by selecting an enrichment database from the following options:

  • Kyoto Encyclopedia of Genes and Genomes (KEGG)[1]: A comprehensive database of biological systems, pathways, and molecular interactions.
  • Reactome[2]: A curated database of biological pathways, including signaling events, metabolism, and cellular processes.
  • Jensen's Diseases[3]: A database that links genes to diseases, helping to understand the impact of phosphosites on disease-related pathways.
  • GO Biological Processes[4]: The Gene Ontology database that categorizes gene products by their roles in cellular processes.
  • GO Molecular Function[4]: Part of the Gene Ontology, focusing on the molecular activities of gene products, such as binding or catalysis.
  • BioPlanet[5]: A pathway database that provides insights into biological processes, focusing on gene regulatory networks.
  • PTMsigDB[6]: A collection of modification site-specific signatures of perturbations, kinase activities and signaling pathways curated from literature.

For PTMsigDB[6], the enrichment analysis is performed at the phosphosite level and can be conducted on kinase, pathway, and perturbation signatures. For the other methods, proteins or peptides corresponding to the phosphosites are used in the analysis. The enrichment analysis can be performed in two modes: live mode [recommended] (using enrichR[7]) or static mode (using pathway annotation database images). In static mode, you can choose between a Fisher's exact test or a hypergeometric test. Additionally, you can set the adjusted p-value cutoff and specify the background phosphosites (for PTMsigDB) or genes (for the other methods) to use in the analysis. Next, set the log ratio threshold to define the up-regulated and down-regulated phosphosites. The top 10 up-regulated and down-regulated pathways are displayed in separate heatmaps, based on their adjusted p-values.

References

1. Kanehisa, M., & Goto, S. (2000). KEGG: kyoto encyclopedia of genes and genomes. Nucleic acids research, 28(1), 27–30. https://doi.org/10.1093/nar/28.1.27
2. Milacic M, Beavers D, Conley P, Gong C, Gillespie M, Griss J, Haw R, Jassal B, Matthews L, May B, Petryszak R, Ragueneau E, Rothfels K, Sevilla C, Shamovsky V, Stephan R, Tiwari K, Varusai T, Weiser J, Wright A, Wu G, Stein L, Hermjakob H, D’Eustachio P. (2024). The Reactome Pathway Knowledgebase 2024. Nucleic Acids Research. 2024. https://doi.org/10.1093/nar/gkad1025.
3. Grissa D, Junge A, Oprea T, Jensen L. (2022) Diseases 2.0: a weekly updated database of disease–gene associations from text mining and data integration, Database, Volume 2022, 2022, baac019, https://doi.org/10.1093/database/baac019
4. Gene Ontology Consortium, Aleksander, S. A., Balhoff, J., Carbon, S., Cherry, J. M., Drabkin, H. J., Ebert, D., Feuermann, M., Gaudet, P., Harris, N. L., Hill, D. P., Lee, R., Mi, H., Moxon, S., Mungall, C. J., Muruganugan, A., Mushayahama, T., Sternberg, P. W., Thomas, P. D., Van Auken, K., … Westerfield, M. (2023). The Gene Ontology knowledgebase in 2023. Genetics, 224(1), iyad031. https://doi.org/10.1093/genetics/iyad031
5. Huang, R., Grishagin, I., Wang, Y., Zhao, T., Greene, J., Obenauer, J. C., Ngan, D., Nguyen, D. T., Guha, R., Jadhav, A., Southall, N., Simeonov, A., & Austin, C. P. (2019). The NCATS BioPlanet - An Integrated Platform for Exploring the Universe of Cellular Signaling Pathways for Toxicology, Systems Biology, and Chemical Genomics. Frontiers in pharmacology, 10, 445. https://doi.org/10.3389/fphar.2019.00445
6. Krug, K., Mertins, P., Zhang, B., Hornbeck, P., Raju, R., Ahmad, R., Szucs, M., Mundt, F., Forestier, D., Jane-Valbuena, J., Keshishian, H., Gillette, M. A., Tamayo, P., Mesirov, J. P., Jaffe, J. D., Carr, S. A., Mani, D. R. (2019). A curated resource for phosphosite-specific signature analysis, Molecular & Cellular Proteomics (in Press). http://doi.org/10.1074/mcp.TIR118.000943
7. Kuleshov, Maxim V., Matthew R. Jones, Andrew D. Rouillard, Nicolas F. Fernandez, Qiaonan Duan, Zichen Wang, Simon Koplev, et al. (2016). "Enrichr: A Comprehensive Gene Set Enrichment Analysis Web Server 2016 Update." Nucleic Acids Res 44 (Web Server issue): W90–W97. https://doi.org/10.1093/nar/gkw377

Enrichment of clusters

Please select a clustering method (Mclust[1] or K-means[2]) to cluster the data set. The optimal number of clusters is determined using the Silhouette method. Enrichment analysis is subsequently run on the cluster members by using the R implementation of enrichR[3] (live-mode) or using Fisher Exact Test/Hypergeometric test on static pathway annotations (see Enrichment Tab). Please note that this step may take a few minutes to complete.

References

1. Scrucca L., Fop M., Murphy T. B. and Raftery A. E. (2016) mclust 5: clustering, classification and density estimation using Gaussian finite mixture models, The R Journal, 8/1, pp. 205-233.
2. Forgy, E. W. (1965). Cluster analysis of multivariate data: efficiency vs interpretability of classifications. Biometrics, 21, 768--769.
3. Kuleshov, Maxim V., Matthew R. Jones, Andrew D. Rouillard, Nicolas F. Fernandez, Qiaonan Duan, Zichen Wang, Simon Koplev, et al. 2016. “Enrichr: A Comprehensive Gene Set Enrichment Analysis Web Server 2016 Update.” Nucleic Acids Res 44 (Web Server issue): W90–W97. https://doi.org/10.1093/nar/gkw377

Prize collecting Steiner's forest

This is the Prize Collecting Steiner's Forest (PCSF) tab[1]. A signaling network is generated based on your data to create a context-specific network for the samples. The network is constructed by combining kinase-substrate predictions with a kinase-kinase regulatory network. You can choose between two types of kinase-kinase networks: the probabilistic kinase-kinase network, which was formulated in a previous publication[2], or the literature-based network described in OmniPath[3].

PCSF has three tunable parameters:

  • The number of trees in the forest (w): This parameter represents the number of individual "trees" (subgraphs or components) used in the network construction. The choice of w determines the overall complexity and the diversity of the solutions. A higher number of trees (larger w) may lead to a more refined and detailed network, but it could also increase the computational cost and complexity.
  • The node prize (b): This parameter introduces a prize for each node (kinase or substrate) that is included in the network. The objective is to find a subgraph that connects some subset of the terminals while maximizing the total prize, subject to a cost constraint (the sum of the edges in the tree). A lower b value will result in fewer nodes being chosen, leading to a simpler network that only includes the most relevant nodes. On the other hand, a higher b value allows for more nodes to be included in the network, which might increase the complexity of the solution but could also capture more subtle relationships.
  • The edge penalty (μ): This parameter introduces a penalty for edges (relationships) between nodes in the network. The penalty is designed to regulate the number of connections or interactions in the constructed network, preventing overfitting or overly dense networks. A higher μ value reduces the number of edges, forcing the network to be more selective about which interactions to include. A lower μ allows for more edges, potentially capturing more complex interactions but also increasing the risk of including noise or irrelevant connections.

PCSF can be executed in three different settings:

  • No parameter search: Run PCSF with a single set of parameters for all samples (very fast).
  • Parameter Grid Search (coarse-to-fine): Run PCSF for all parameter combinations (b, w, μ) on the first sample and then use the best parameter setting to locally search for the best parameter settings for the other samples
  • Parameter Grid Search (full): Run PCSF for all parameter combinations (b, w, μ) for all samples (very slow for high number of samples).

For both grid search approaches, you can specify the minimum and maximum values for each parameter, as well as the step size. A smaller step size increases the likelihood of identifying a high F1 score, but comes at the cost of longer computation times. For all samples, the solution with the highest F1 score—based on kinase-substrate relationships—is plotted as a network and can be downloaded as a table. Additionally, one tabular tab is created with the precision, recall and F1 scores for all tested parameter combinations.

Reference

1. Akhmedov M, Kedaigle A, Chong RE, Montemanni R, Bertoni F, et al. (2017) PCSF: An R-package for network-based interpretation of high-throughput data. PLOS Computational Biology 13(7): e1005694. https://doi.org/10.1371/journal.pcbi.1005694
2. Brandon M. Invergo, Borgthor Petursson, Nosheen Akhtar, David Bradley, Girolamo Giudice, Maruan Hijazi, Pedro Cutillas, Evangelia Petsalaki, Pedro Beltrao, 2020, Prediction of Signed Protein Kinase Regulatory Circuits, Cell systems, Pages 384-396.e9, ISSN 2405-4712, https://doi.org/10.1016/j.cels.2020.04.005.
3. D Turei, T Korcsmaros and J Saez-Rodriguez (2016) OmniPath: guidelines and gateway for literature-curated signaling pathway resources. Nature Methods 13 (12). https://doi.org/10.1038/nmeth.4077

Kinase activity heatmap

Kinase activities are quantified using multi-level FGSEA (Fast Gene Set Enrichment Analysis), which identifies kinases that are significantly active based on the log2 values of their substrates in your data. The FGSEA approach ranks phosphorylation sites and calculates the Normalized Enrichment Scores (NES). To assess the kinase activities for the probabilistic SELPHI network, we are quantifying overrepresentation of kinase's substrate at the top of the phosphorylation distribution (top 5%)

For comparison, kinase activities are also calculated using PhosphoSitePlus substrates, a well-established repository of experimentally validated phosphorylation sites, as well as from experimentally predicted kinase-substrate relationships derived from the Sugiyama dataset.

The 20 kinases with the most extreme NES are plotted on the webserver. A full heatmap with all enriched kinases can be downloaded.


Download heatmaps

Experimentally supported edges

Here you can download a list of experimentally supported SELPHI2 predictions. Two recent high-throughput studies are used to corroborate kinase substrate predictions[1],[2]. The boxplot presented below, shows the probability assigned to the edges that are supported by either or both of these external studies as compared to the background of unsupported edges.

References

1. Hijazi, M., Smith, R., Rajeeve, V., Bessant, C. and Cutillas, P. R. Reconstructing kinase network topologies from phosphoproteomics data reveals cancer-associated rewiring. Nat. Biotechnol. 38, 493–502 (2020). https://doi.org/10.1038/s41587-019-0391-9
2. Sugiyama, N., Imamura, H. and Ishihama, Y. Large-scale Discovery of Substrates of the Human Kinome. Sci. Rep. 9, 10503 (2019) https://doi.org/10.1038/s41598-019-46385-4

Prediction Annotation

Download

Prediction Annotation Boxplot

Download

Welcome to the sephi2 server

1. To upload data please press Browse under the Choose File option. Alternatively one of three examples can be picked under select examples.

2. To correctly upload your data please indicate if the first line contains sample names then select separator, that is how values in your table are separated.

3. The standard format for SELPHI2 has sample names as first row, gene names and position in the first column and data values in all subsequent columns. If your data is, for example, processed output from a mass spectrometry analysis, the following steps need to be followed:


(i) check the "Does the input need to be reformated?"
(ii) Indicate which column contains protein names
(iii) Indicate which which column contains the residue number

(iv) Give substring that identifies relevevant data columns. For example, if your samples are named:

sample_1, sample_2,..., sample_n, the substring sample will identify the data columns. Please make sure that the substring is unique to relevant columns.

4. Please select the number of rows to skip in the file, this option is for files with titles or descriptions at the head of the fie.

5. Select type of protein Ids Selphi2 currently support Uniprot accession and HGNC.

6. Predictions can be made for the phosphosites in the data set in the following ways:
(i) Random forest: Random forest classifier was used to generate a list of kinase substrate prediction as is described in our recent publication[1], which can be downloaded from Zenodo. Kinase-substrate relationships with a score below 0.3 were filtered out for the webserver for better performance. By default, we consider 0.5 as cutoff for kinase-substrate relationships.
(ii) Random forest functional: Same as (i) but only for phosphosites that are likely to be functional according to functional score developed previously[2].

All available predictions can also be downloaded.

If all information was provided correctly, the main panel should look similar to the figure below.

References

1. Maier BD#, Petursson B#, Lussana A# and Petsalaki E, SELPHI 2: Data-driven extraction of human kinase-substrate relationships from omics datasets. bioRxiv, 2024. https://doi.org/10.1101/2022.01.15.476449
2. Ochoa, D., Jarnuczak, A.F., Viéitez, C. et al. The functional landscape of
the human phosphoproteome. Nat Biotechnol 38, 365–373 (2020). https://doi.org/10.1038/s41587-019-0344-3

Enrichment of regulated phosphosites

This is the enrichment submission page.

1. Please select database to enrich against, available are: Reactome, KEGG, Jensen's diseases and GO

2. Please select log ratio threshold to detrmine wich phosphosites count as regulated. Enrichment annalysis is applied on the proteins

that include a regulated phosphosite.

3. Select clustering methods. This clusters the data and uses each cluster as a set for enrichment.

Enrichment is conducted by using the enrichR[1] package. Separate heatplots are generated for the down and up-regulated phosphosite.

4. To enrich up/downregulated sites, slelct the UP/DOWNREGULAED PSITES and hit start.

5. To start clustering enrichment select clusters and press start.

A successful submission results in a figure as shown below.

References

1. Kuleshov, Maxim V., Matthew R. Jones, Andrew D. Rouillard, Nicolas F. Fernandez, Qiaonan Duan, Zichen Wang, Simon Koplev, et al. 2016. “Enrichr: A Comprehensive Gene Set Enrichment Analysis Web Server 2016 Update.” Nucleic Acids Res 44 (Web Server issue): W90–W97. https://doi.org/10.1093/nar/gkw377

Map signalling network onto data

A signalling network is fitted to uploaded data to generate a context specific network for the samples in the data. The network is generated by combining the kinase substrate predictions and a kinase kinase regulatory network. You can choose between probabilistic kinase-kinase network which was formulated in a previous publication[2] and the literature network as described in OmniPath[3].

1. Choose Pruning: None includes all proteins in the data; TS/PPS/KS will only include Phosphatases, Kinases and transcription factors

2. Chosse network probability to select kinase substrate probability threshold

3. Choose between probabilistic kinase-kinase network which was formulated in a previous publication[2] and the literature network as described in OmniPath[3].

4. Select log2 threshold to seect phosphosites that are to be included in the sub-network

5. Parameter tuning: PCSF has three tunable parameters:
(i) w: the number of trees in the forest
(ii) b: the node prizes: the higher the value, the greater the prize for including nodes
, (iii) μ: the edge penalty: the higher the value, the higher the penaliation for including edges
You can select the minimum and maximum values for each of these parameters and the increment. All possible parameter combinations are tested the solution with the best F1 score with regards to kinase substrate relationships

6. Press start

Successful run will look like the image below.

Reference

1. Akhmedov M, Kedaigle A, Chong RE, Montemanni R, Bertoni F, et al. (2017) PCSF: An R-package for network-based interpretation of high-throughput data. PLOS Computational Biology 13(7): e1005694. https://doi.org/10.1371/journal.pcbi.1005694
2. Brandon M. Invergo, Borgthor Petursson, Nosheen Akhtar, David Bradley, Girolamo Giudice, Maruan Hijazi, Pedro Cutillas, Evangelia Petsalaki, Pedro Beltrao, 2020, Prediction of Signed Protein Kinase Regulatory Circuits, Cell systems, Pages 384-396.e9, ISSN 2405-4712, https://doi.org/10.1016/j.cels.2020.04.005.
3. D Turei, T Korcsmaros and J Saez-Rodriguez (2016) OmniPath: guidelines and gateway for literature-curated signaling pathway resources. Nature Methods 13 (12). https://doi.org/10.1038/nmeth.4077

~

Kinase activity heatmap

Kinase activities are quantified using multi-level FGSEA (Fast Gene Set Enrichment Analysis), which identifies kinases that are significantly active based on the log2 values of their substrates in your data. The FGSEA approach ranks phosphorylation sites and calculates the Normalized Enrichment Scores (NES). To assess the kinase activities for the probabilistic SELPHI network, we are quantifying overrepresentation of kinase's substrate at the top of the phosphorylation distribution (top 5%)

For comparison, kinase activities are also calculated using PhosphoSitePlus substrates, a well-established repository of experimentally validated phosphorylation sites, as well as from experimentally predicted kinase-substrate relationships derived from the Sugiyama dataset.

The 20 kinases with the most extreme NES are plotted on the webserver. A full heatmap with all enriched kinases can be downloaded.